.png)
.png)


iAdvize
The goal of all marketing strategies is to bring in more customers and drive sales. While both are important, they aren't the only pieces of the puzzle when it comes to growing revenue. Another vital element is your average order value (AOV).
While building ecommerce store traffic is vital, especially for early-stage online businesses, you shouldn't neglect your average order value. Here's why:
- A higher AOV leads to healthier cash flow, which increases financial stability for your brand.
- Website traffic influxes are tied to search engine updates and algorithm shifts. Your company has no control over these changes—and your traffic and revenue can suffer while adapting to new search norms.
- Improving your average order value lets you weather ups and downs in traffic from any source to help you build more revenue streams that are predictable.
Reviewing the basics about how to calculate this KPI is the first step. Once you understand that, you can explore different factors that affect it—such as industry, seasonality, and traffic sources. You can also always apply a more traditional upselling technique like targeted price increases or free shipping thresholds.
However, today's most forward-thinking brands use innovative marketing strategies to increase their average order value. They use pre-sales and post-purchase personalization tactics to provide customers with tailored responses and product recommendations.
How To Calculate Average Order Value
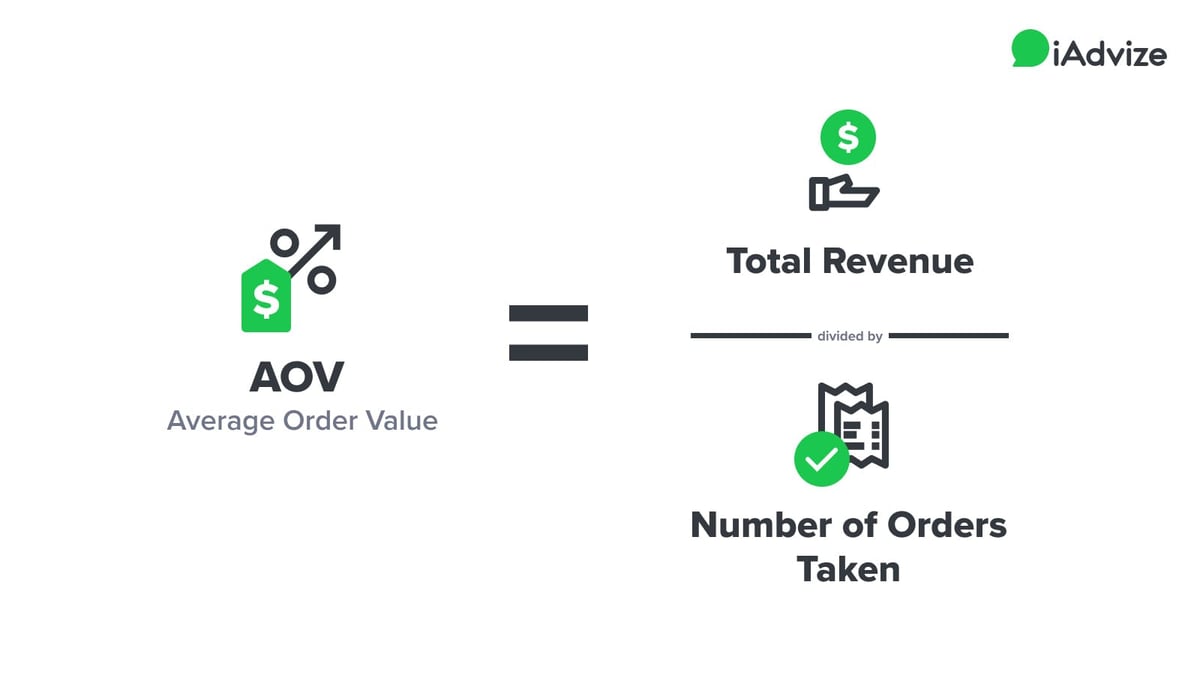
The formula to calculate this is simple. All you need to do is divide your total revenue by the number of orders taken.
But don't let the simplicity of the calculation lead you to dismiss this as a less-than-critical metric. It's important to calculate it frequently to better track your customers' buying trends. What can an average order value show you?
Imagine you have the following sales numbers over a two month period:
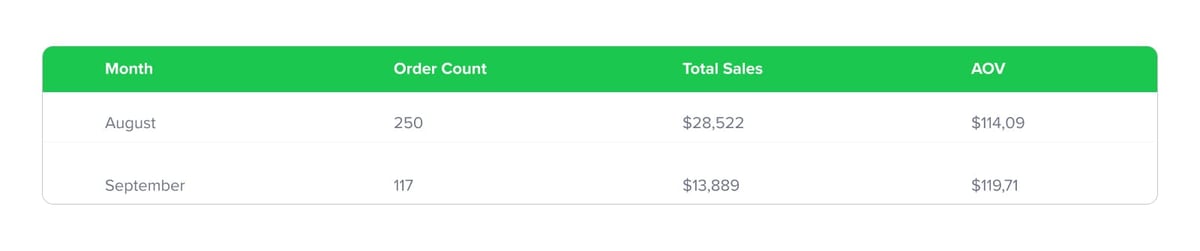
These numbers tell you that while orders have dropped significantly, your AOV has increased. This means that you should focus on customer acquisition to improve your conversion rate.
You can also compare these trends to prior years. Has August typically been a big sales month over the years? Is there usually a dip in September? Looking at previous data can tell you if your current performance is on par, better, or worse than during the same period the year before. This insight can then help you better understand what to adjust to ensure continued revenue growth.
Many Factors Affect Your Average Order Value
Now that you know how to calculate your average order value, pinpointing your industry and competitor benchmarks is the next step. You should take the time to examine this across multiple dimensions, including the devices visitors use to access your site and seasonality.
That being said, start to look at cross-industry benchmarks to gauge your brand's average order value. Recently, this has tended to peak during Q4, likely as a result of holiday shopping.
Your Industry's Role In Average Order Value
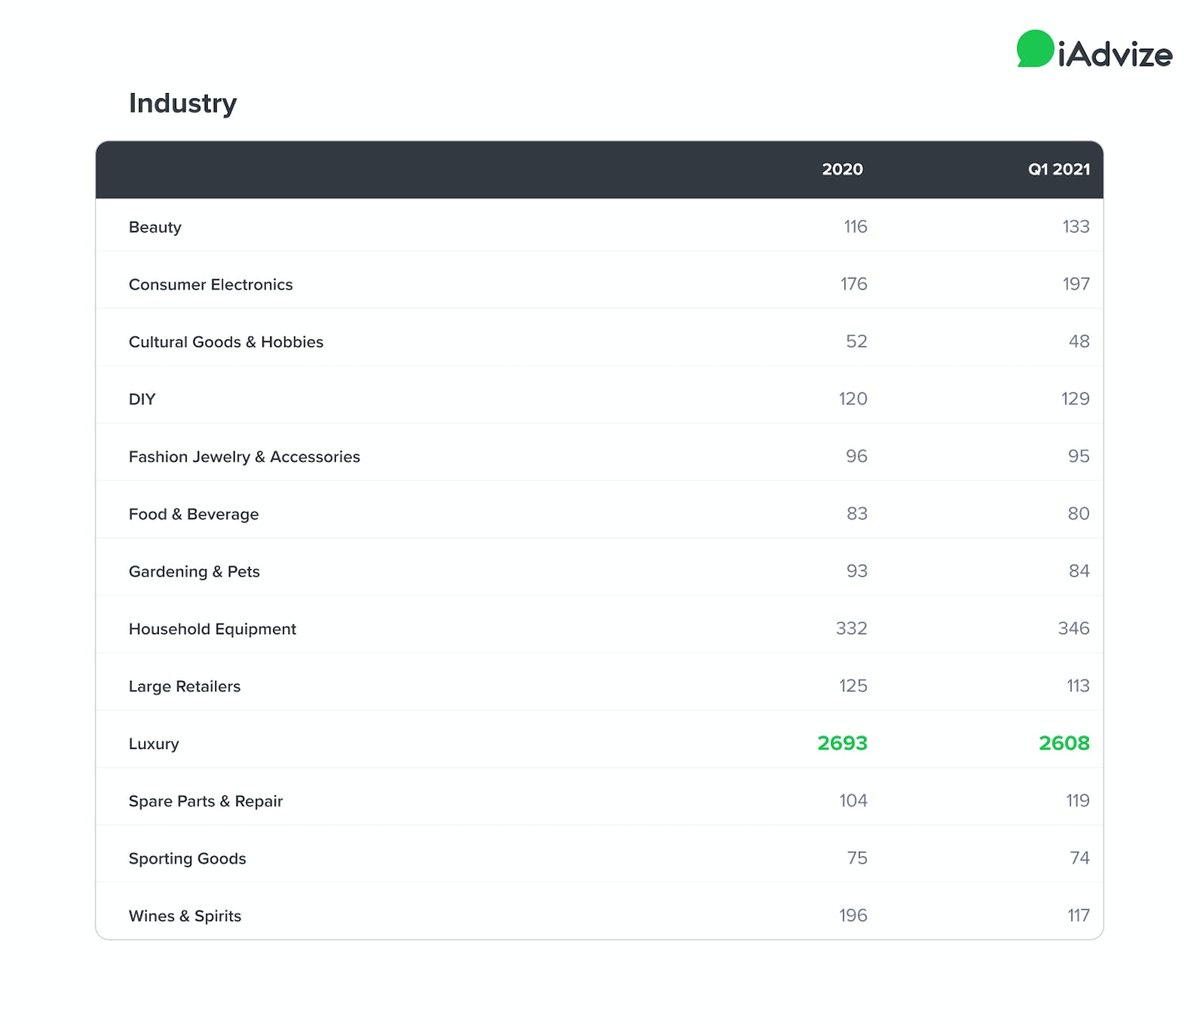
Your industry plays a big role in your average order value. Brands and retailers that sell bigger-ticket items, like electronics or home furnishings, will typically have a higher AOV than ones that sell lower-priced products.
When assessing how yours compares to your competitors, it's important to consider it in the context of your industry. Consumers' buying needs evolve over time so this metric will fluctuate.
We track average order value for clients across all industries, as you can see below:
Seasonality & Average Order Value
It's no surprise that this KPI surges during specific seasons throughout the year. Most retailers anticipate that year-end holidays will be a busy season. Depending on the nature of your business, you may find that order sizes increase as shoppers prepare for outdoor activities in the spring, vacations in the summer, or back-to-school in the fall.
It could be helpful to track average order value during your busiest seasons and compare results year-on-year. This way, you can observe trends and trajectories over time. Equipped with these insights, you can then assess average order value trends within your industry or location.
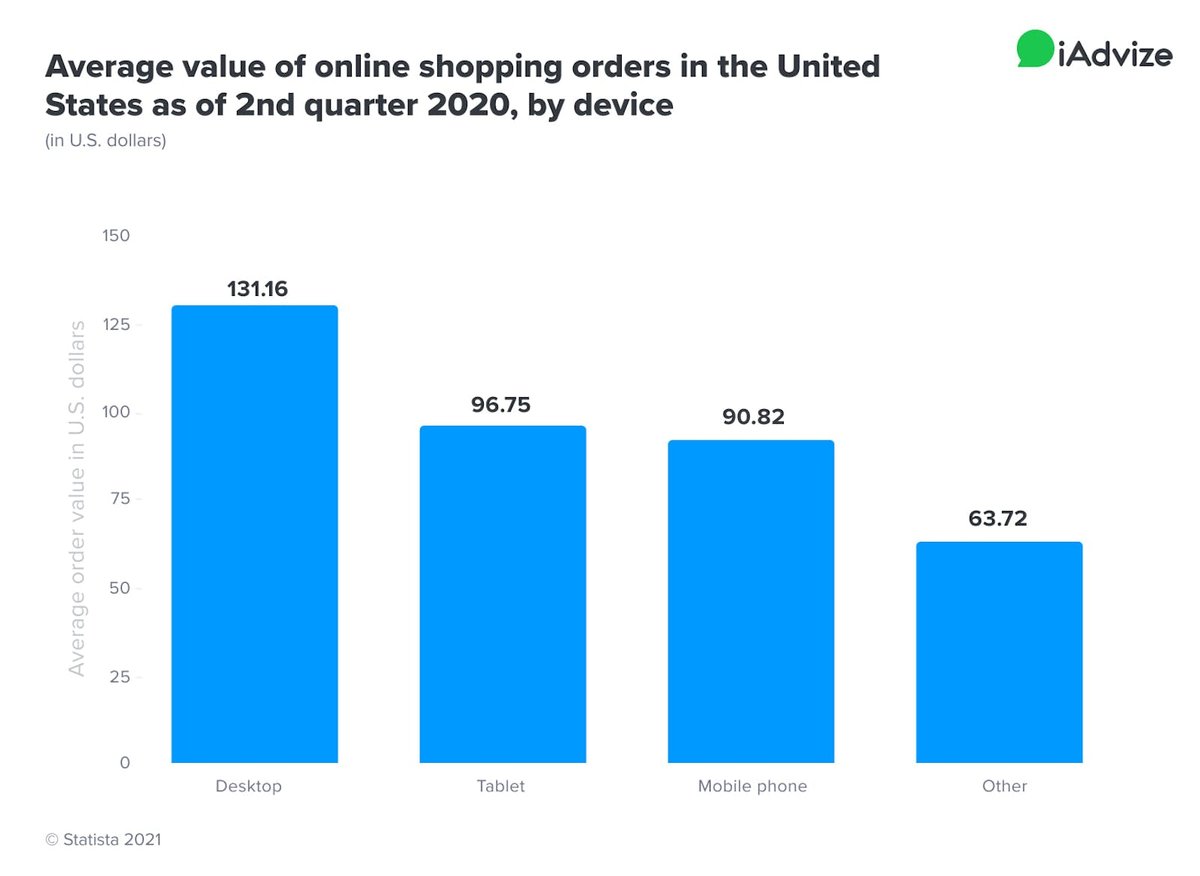
Devices Used for Measuring Average Order Value
Analyzing average order value during peak seasons helps you prepare for those high revenue-generating months. However, you shouldn't rely solely on one season to carry you through the year. Looking at this metric across different devices over time can help you understand how the changes you make to the digital experience drive sales.
Desktops have long held the top spot for many e-commerce metrics. This data from Statista is one example, where desktop average value outperformed all other channels, including tablet and mobile. Of course, during this period many people were spending more time at home due to COVID restrictions, so an increase in purchasing from a desktop made sense.
Traffic Sources & Average Order Value
Another way to explore average order value is by considering the traffic source driving your customers' purchasing habits. This insight can tell you whether your search, email, or social campaigns are delivering the best order value.
On average, online buyers who visit websites directly place the largest orders. Most likely, this trend occurs because customers who visit websites directly are familiar with the brand and may already know exactly what they want to buy. Email average order value also tends to be high throughout the year, which is to be expected for a audiences that have opted in to receiving promotions from retailers.
By contrast, search and social media marketing are customer acquisition tactics designed to drive new business. Both sources typically see lower average order value.
Store Performance & AOV
Your brand's reputation and relationships with customers also affects your average order value.
What does this mean? Customers tend to buy more from companies they know and trust. Brands that perform well secure more purchases and can keep investing in innovation and digital experiences.
5 Strategies For Improving Your AOV
Performing an analysis on important metrics, like average order value, helps you understand how your company performs in comparison to your industry and across other dimensions. Once you understand your company's trends, you can implement the following strategies to improve your average order value.
Increase Pricing
The simple pricing strategy of increasing your product and service prices is the most straightforward way to increase order value. However, it's important to consider this approach carefully. New customers unfamiliar with your previous pricing may have no issues paying a higher price, but repeat customers who know what you have charged in the past may balk at paying more and start looking for alternatives.
Staging moderate prices increases on select products is going to solve this issue and work better than instituting an across-the-board price hike. You may also want to offer discounts or promotions in tandem with this new pricing to help customers feel like they are still getting a good deal.
Offer Bundle & Package Options
Encouraging shoppers to buy more products from you is another way to increase your average order value. Bundles, package deals, and volume discounts can help you achieve this goal.
Establish A Free Shipping Threshold
Every time you motivate customers to buy more from your site, you increase your order value. Offering free shipping after a certain amount spent is an excellent way to meet this objective. Another strategy for this is to have a threshold only on select items where you can make a profit.
Offer Discounts on Future Purchases
Offer discounts on future purchases. You can do this by setting a threshold that once reached, allows buyers to earn dollars they can put towards future purchases. This way, you can motivate shoppers to buy more to reach this amount in the moment.
Buy More, Save More
Everyone knows that buying in bulk can save money—and you can use this strategy on your website to increase order value. Make sure that the money-saving potential of purchasing multiple items at once is clearly available on your site to nudge shoppers to buy more.
Consultative Pre-Sales Service Can Increase Your Order Value
Today's leading brands go beyond traditional tactics to increase order value and improve their conversion rate. Adopting a conversational commerce strategy that focuses on giving customers opportunities for personalized connections at scale, is the best way to improve your average order value and gain a competitive advantage.
Why does digital conversation work so well? Online shopping, while convenient, lacks some of the interpersonal appeal of brick-and-mortar shopping. Shoppers can touch, feel, or try on goods, or easily engage with sales representatives when shopping online. This self-service experience can cause shoppers to hesitate about purchases, and is a driving factor behind the consistently high cart abandonment rates seen in digital retail.
Many brands have customer support teams that focus on concerns and questions post-purchase. However, these customer-facing agents only specialize post-purchase service and can't always provide quality pre-sales advice and recommendations for products shoppers may be considering.
A conversational commerce approach provides the authenticity and expertise that digital shoppers need. Customers can receive tailored support from communities of brand enthusiasts who have purchased and use the brand's products themselves.
When shoppers receive personalized responses, they feel more confident about their buying decisions, and our experience working with online retailers proves that conversation fosters higher order value. One of our clients achieved a 12% uplift in AOV after implementing brand experts to handle pre-sales questions on their e-commerce website.

Average Order Value Is A Critical Metric for Every E-commerce Retailer
There are many measures of success in business. At times, it can feel difficult to understand which ones require more attention and which are less critical. However, average order volume is one KPI that every retailer with a digital presence and ecommerce store should be tracking.
Calculating it is easy. All you need to know is your total sales and total orders for a specific period. You should be determining your overall AOV for your company on a regular basis. Many businesses even update it monthly. This analysis will give you a quick snapshot of your customers' buying patterns and help you pinpoint seasonal trends.
You can also compare your average order value to others in your industry to benchmark yourself against competitors. Furthermore, you can examine it by device or site traffic source and use that insight to refine the user experience and your outbound campaigns.
There are many tried-and-true tactics that can help improve your average order value—such as price increases, discounts on future purchases, bundles, and more. It's worthwhile to test each pricing strategy and determine which benefit you the most.
Conversational commerce, including generative AI customer solutions, is the clearest path to proven average order value uplift. Through messaging personalization, you can offer site visitors product information and recommendations that assist them in their buying journey. This helps retain existing customers and increase your conversion rate.
Even incremental increases in your average order value can yield big gains for your company, and the use of generative AI is emerging as the best way to accomplish this. Learn more about the different types of AI assistants you can integrate into your ecommerce website at the link below.